A costed decision framework for AI tool replacement: six drift signals that justify the question, five gates that answer it, and the switching tax that most teams never put on the bill.
Key takeaways • Replacement is justified by a documented deficit against a defined job of work, never by a leaderboard movement, a demo, or a competitor announcement. • The subscription price difference is the smallest line on the bill. Workflow rebuild, retraining and the transition output dip account for close to seventy percent of the true cost of switching. • As a working rule, a challenger needs roughly a twenty five percent advantage on the metric that matters before payback lands inside a normal planning horizon. • Reversibility is a property of the layer, not the vendor. Interface tools cost days to leave. Tools holding memory, tuning, embeddings or agent state cost months. • Every migration should carry a rollback checkpoint dated before cutover completes, so that abandoning the switch stays an ordinary outcome rather than an admission of failure. |
Replacement is now a standing decision, not an occasional one
For most of enterprise software history, replacing a tool was close to a generational event. A finance package lasted a decade, a customer database lasted five years, and the switching question arrived politely with the renewal notice. Artificial intelligence broke that rhythm. Capability moves in weeks, pricing resets in months, and a tool that was the obvious choice in January can be quietly mid-table by September without anything about it getting worse.
The exposure has widened alongside the pace. Platform data published by software management vendor Cledara indicates that eighty five percent of companies now hold dedicated AI subscriptions, that the average business pays for around 4.5 AI tools, that AI subscriptions grew eighty four percent year over year, and that close to one in three new software purchases is an AI product. Every one of those subscriptions carries a replacement question that never fully closes.
What has not kept pace is decision discipline. Anxiety is widespread: one industry survey of technology leaders reported that ninety four percent fear vendor lock-in as AI becomes embedded in enterprise infrastructure. Anxiety, however, is not a method. It produces two opposite errors, and both are expensive.
This article sets out a single named method for resolving the question, the Displacement Test, supported by four instruments: the Six Drift Signals, the Switching Tax Ledger, the Replacement Break-Even Model and the Displacement Quadrant. The premise throughout is that replacement is an investment decision with a payback period, not a matter of preference or appetite.
The two ways this decision goes wrong
Novelty churn
Novelty churn is the replacement of a working tool because a newer one posted a stronger benchmark, shipped a striking demo, or was adopted by a visible competitor. The costs land immediately and the gains are usually unmeasured, because nothing was measured before the switch either. The diagnostic symptoms are consistent: a stack that changes faster than staff reach proficiency, evaluation that consists of a short trial by one enthusiastic person, and no written record of what the outgoing tool actually failed at.
Terminal loyalty
Terminal loyalty is the opposite error, and it is quieter. A tool is kept long past the point where it earns its place because the prompts are tuned, the integrations are wired, and the workarounds have been absorbed into how work is done here. The tell is asymmetric visibility: the cost of the incumbent has become invisible while the cost of any alternative is vivid and itemized. Sunk investment gets counted as a reason to stay, when in fact it is already spent and carries no information about the next twelve months.
The disciplined position sits between the two. It treats the stack as a portfolio under periodic review, with thresholds declared in advance so that the decision does not depend on who happens to be enthusiastic in a given week.
Six Drift Signals: building the measurable case
A replacement case begins with drift, meaning the widening gap between what a tool delivers and what the job requires. Drift is measurable, and measuring it in six named dimensions prevents the most common distortion, which is treating one vivid failure as evidence of systemic decline.
| Drift signal | What gets measured | Replace-trigger threshold | Cadence |
| Capability drift | Task success rate on a fixed internal benchmark set | Trails a tested alternative by 15 points or more on the primary job | Quarterly |
| Economic drift | Fully loaded cost per completed unit of work | Exceeds the market equivalent by 40 percent or more | Quarterly |
| Workflow drift | Rework hours and standing workarounds per week | More than three standing workarounds, or rework above 10 percent of task time | Monthly |
| Reliability drift | Availability, p95 latency, deprecation notices | Two or more service breaches in a quarter, or under 90 days notice on a deprecation | Continuous |
| Governance drift | Data residency, audit logging, certifications, subprocessor changes | Any unmet mandatory control with no dated remediation commitment | On change, plus annually |
| Roadmap drift | Vendor direction measured against the buying team's roadmap | Two consecutive release cycles with nothing relevant to the primary job | Half-yearly |
Table 1. The Six Drift Signals. Thresholds are starting values and should be recalibrated to the risk profile of the workload.
A single signal is a prompt to investigate, nothing more. Two concurrent signals sustained across two review cycles constitute a documented deficit, which is the entry condition for the first gate of the Displacement Test. Signals need to be recorded with dates as they occur. A deficit that exists only in recollection will not survive contact with the switching tax, and the argument will collapse into preference at exactly the moment it needs to be evidence.
Economic drift and the moving price floor
Economic drift deserves separate treatment because it is the most common trigger and the most frequently misread. In every other category, the tool has to deteriorate for a deficit to open. In this one, the floor moves underneath a perfectly functional tool.
The scale of that movement is not subtle. When GPT-4 reached general availability in March 2023, published API pricing sat at thirty dollars per million input tokens and sixty dollars per million output tokens. By April 2026, Gemini 3.1 Flash was published at ten cents per million input tokens and forty cents per million output tokens. Independent price tracking placed a frontier token index at 16 against a March 2023 base of 100 as of 2 September 2026, with a median flagship model at six dollars per million blended tokens across twenty one tracked constituents.
Three consequences follow for replacement decisions. First, an unrenegotiated contract gets worse every quarter simply by standing still. Second, deterioration is not a precondition for a legitimate replacement case, which means teams waiting for a tool to visibly fail will systematically be late. Third, and most usefully, price movement is a trigger for renegotiation long before it is a trigger for replacement, because renegotiation carries no switching tax whatsoever.
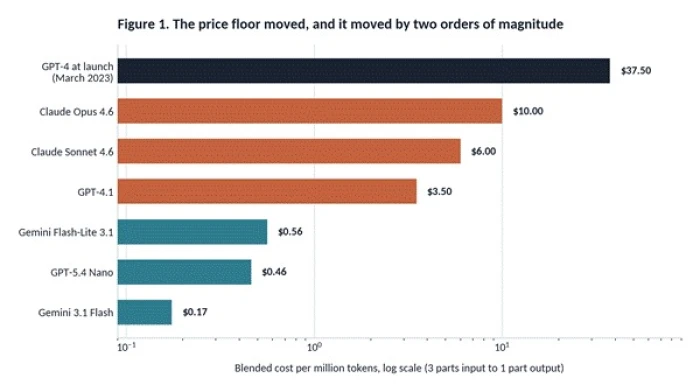
Figure 1. Blended cost per million tokens on a logarithmic scale, using a three-to-one input-output blend. Published list prices: GPT-4 at launch in March 2023, and 2026 tiers as published between March and September 2026. Verify current rates before any commitment.
One counterweight belongs alongside the headline numbers. Reasoning models consume far more tokens internally than they emit, so a lower published rate can still produce a larger monthly bill at identical workload. Comparisons drawn on the rate card are unreliable. Cost per completed unit of work, inclusive of retries, failed generations and human review time, is the only economic comparison that survives contact with production.
The Switching Tax Ledger: what replacement actually costs
The dominant error in AI stack decisions is comparing two subscription prices and calling the difference a saving. The subscription differential belongs in the running-cost column. It is not a switching cost. The switching cost is a separate, one-off, six-line ledger that has to be priced before any comparison means anything.
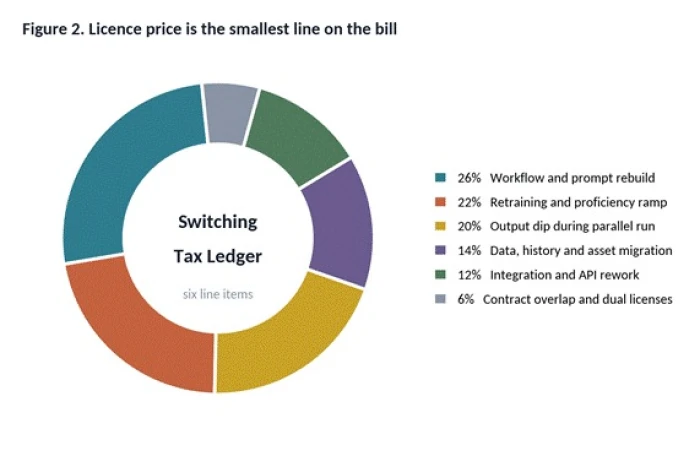
Figure 2. Modeled allocation of one-off switching costs for a mid-sized team migration. The subscription differential is excluded because it is a running cost rather than a switching cost. Components follow documented migration cost drivers, including twenty to forty retraining hours per seat and a fifteen to twenty five percent transition output dip.
| Ledger line | How it gets priced | Common estimating error |
| Workflow and prompt rebuild | Hours to re-author prompts, templates, chains and tool schemas, at loaded hourly cost | Assuming prompts port unchanged between models |
| Retraining and proficiency ramp | Seats multiplied by hours to competence, at loaded hourly cost | Counting formal training only and ignoring self-directed ramp |
| Output dip during parallel run | Baseline output multiplied by expected dip percentage multiplied by dip duration | Assuming productivity runs flat from day one |
| Data, history and asset migration | Export, transform and validate, plus the value of anything that cannot move at all | Treating an export button as a migration plan |
| Integration and API rework | Connector rebuild, authentication, monitoring, alerting and the evaluation harness | Forgetting the evaluation and observability layer entirely |
| Contract overlap and dual licensing | Overlap months multiplied by both subscription costs | Assuming a clean, single-day cutover |
Table 2. The Switching Tax Ledger. Every line is a one-off cost. None of them appears on a pricing page.
Published guidance on software replacement puts the individual ramp at twenty to forty hours per person to reach proficiency, and the transition-period productivity drop at fifteen to twenty five percent while staff toggle between old and new systems or quietly revert to manual processes. Gartner research cited in the same analysis found that fifty six percent of software replacement projects exceed budget, primarily because of these hidden migration costs. At the infrastructure end of the range the numbers get larger: one API platform vendor puts the average enterprise cost of a lock-in migration at 315,000 dollars, while a separate enterprise analysis places AI vendor switching costs at nineteen to thirty four percent.
The subscription differential is a running cost, not a switching cost. Treating it as the whole cost is the single most expensive habit in AI procurement.
The Replacement Break-Even Model
Once the ledger exists, the decision becomes arithmetic. The break-even month is the point at which cumulative spending under the replacement crosses cumulative spending under the incumbent.
Payback months = Total switching tax divided by (monthly cost saving + monetized monthly value of the capability gain)
Figure 3 runs that arithmetic across three scenarios, holding the switching tax constant at 540 index units against an incumbent run rate of 100 units per month, with a transition dip of 63 units spread across the first three months.
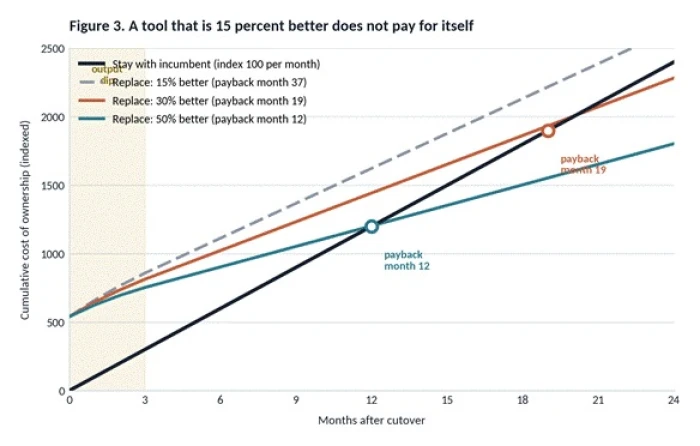
Figure 3. Modeled break-even. Inputs: incumbent run rate indexed at 100 per month, a one-off switching tax of 540 index units, and a transition output dip of 63 units spread across the first three months. Payback is the month in which the cumulative replacement line crosses the cumulative incumbent line.
The result is the most important single finding in this framework. A challenger that is fifteen percent better does not repay the migration for more than three years, which in a category moving this quickly is functionally never. At thirty percent better, payback lands in month nineteen. At fifty percent better, it lands in month twelve.
That produces a usable rule of thumb, and it is worth stating plainly. Given a switching tax in the region of five to six months of run-rate spending, which is the common case for anything above the interface layer, a challenger needs an advantage of roughly twenty five percent on the metric that matters before the switch repays itself inside a normal planning horizon. This is not a universal constant. It falls directly out of the arithmetic, and it moves when the switching tax moves, which is precisely why the ledger has to come first.
The service life caveat
A second-order test matters just as much and is almost always skipped. Payback must arrive before the replacement is itself replaced. If a category is turning over every eighteen months, a nineteen-month payback never lands, and the migration is a pure loss regardless of how favorable the comparison looked. In fast-moving categories the expected service life of any given tool is shrinking, which is the strongest available argument for investing in portability rather than in selection. A portable stack converts a payback problem into a configuration change.
The Displacement Quadrant: four verdicts, not one
Capability gap and switching tax are independent variables, and a decision made on either one alone will be wrong roughly half the time. Plotting both produces four distinct verdicts.
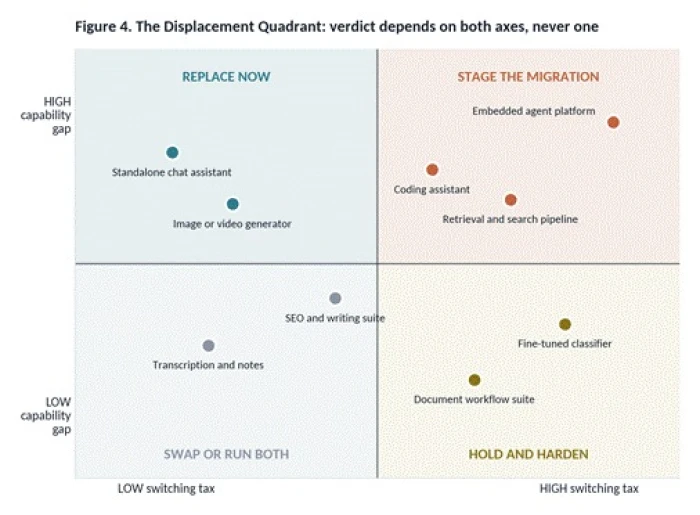
Figure 4. Framework map. Tool classes are plotted at typical positions rather than measured ones. Any individual stack should be plotted from its own audit.
• Replace now, meaning high capability gap and low switching tax. The case is clear, the exposure is small, and delay costs more than action. Most interface-layer tools live here.
• Stage the migration, meaning high gap and high tax. A direct cutover here is how migrations fail publicly. The correct sequence is to insert a routing or abstraction layer first, prove the challenger on a slice of real traffic, then move the remainder in cohorts.
• Swap or run both, meaning low gap and low tax. The switch is cheap enough that parallel operation is frequently better than a decision at all. Image generation is the clearest example, because output variety carries independent value.
• Hold and harden, meaning low gap and high tax. The correct verdict is investment in the incumbent combined with exit preparation: renegotiate, export on a schedule, and document the workflow so that a future migration is cheaper than this one would be.
The quadrant is a snapshot, and the horizontal axis can be moved deliberately. Gartner projects that seventy percent of organizations building applications across multiple language models will use AI gateway capabilities by 2028, up from under five percent in 2024. That shift is a collective bet that switching should be routine rather than exceptional.
Reversibility is a property of the layer, not the vendor
Teams routinely assume that switching cost is a function of which vendor they chose. It is far more strongly a function of which layer the tool occupies. Three layers behave very differently.
The interface layer
Chat assistants, generators and transcription tools sit here. Artifacts are exportable, skills transfer between products, and nothing accumulates that cannot be recreated. Leaving costs days.
The state layer
Assistants with persistent memory, fine-tuned models, embedding stores and accumulated evaluation history sit here. The expense is not the code; it is that the accumulated context does not move. A fine-tuned model cannot be exported to a competitor, and months of behavioral calibration go with the vendor or go nowhere.
The infrastructure layer
Retrieval pipelines, tool schemas and agent platforms sit here, and migration becomes a multi-layer rebuild rather than an endpoint change. Research referenced by automation vendor Zapier found that the organizations most deeply locked in are not those that adopted AI earliest, but those that adopted agentic AI. Early integrations against a model API were reversible. Agentic workflows carrying memory, tool access and multi-agent coordination are not.
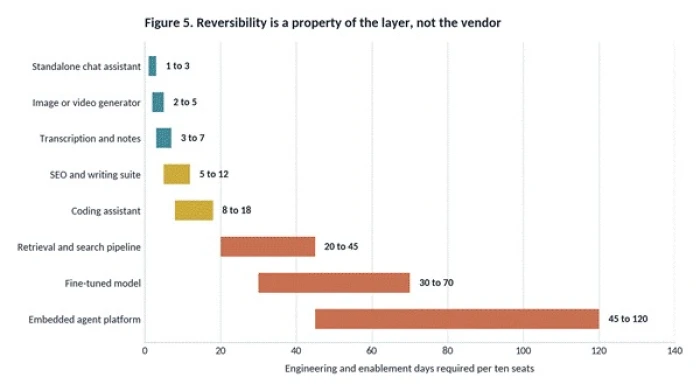
Figure 5. Modeled effort bands, expressed in engineering and enablement days per ten seats. Interface-layer tools are cheap to leave. Tools holding memory, tuning, embeddings or agent state require a multi-layer rebuild rather than an endpoint change.
The practical consequence is that reversibility belongs in the purchase criteria, not in the exit post-mortem. It should be scored before signature, when it costs nothing to insist on, rather than discovered eighteen months later when it costs everything. Routing benchmarks published by RouteLLM, from UC Berkeley and LMSYS, report up to eighty five percent lower cost at ninety five percent of GPT-4 quality on MT-Bench, with thirty to forty percent typical in production. An abstraction layer frequently pays for itself on running costs before any replacement decision is even tabled.
Timing: every replacement is paid for before it pays out
Even a correct replacement decision imposes a period of reduced output. Microsoft's internal analysis of its own AI assistant rollout identified a distinct dip in enthusiasm between weeks three and ten, precisely when novelty faded and the work of integrating the tool into daily practice began. Combined with the documented fifteen to twenty five percent transition drop, the shape is predictable enough to schedule around.
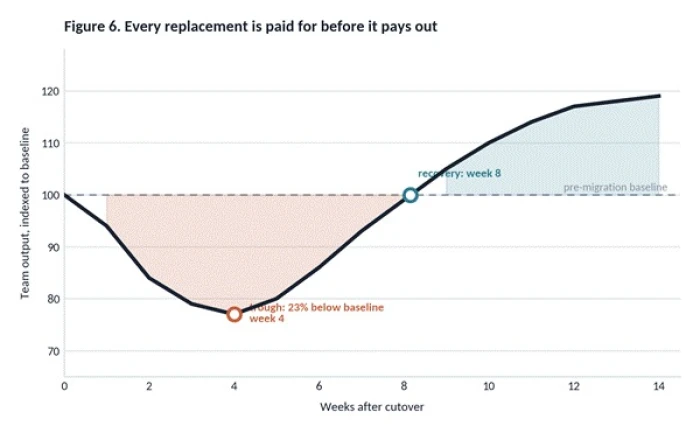
Figure 6. Modeled adoption J-curve. The shape follows documented transition patterns: a fifteen to twenty five percent output drop while staff toggle between systems, and an enthusiasm trough concentrated between weeks three and ten. The shaded area below the baseline is line three of the Switching Tax Ledger.
Because the shape is predictable, timing rules can be set in advance:
• Never cut over inside a peak demand window or a reporting close.
• Never cut over within sixty days of an audit or certification review, because the evidence trail will be split across two systems.
• Never cut over during the onboarding of a new cohort, because new staff will learn the workaround rather than the workflow.
• Prefer a cutover that lands at least eight weeks before the next material deadline, which is the observed recovery point in most rollouts.
• Stagger by cohort rather than by feature, so that a rollback affects a group rather than a capability everyone depends on.
The Displacement Test: five sequential gates
The instruments above supply evidence. The Displacement Test converts that evidence into a decision. The gates run in sequence, and a candidate that fails any gate returns the decision to the incumbent rather than proceeding to the next question.
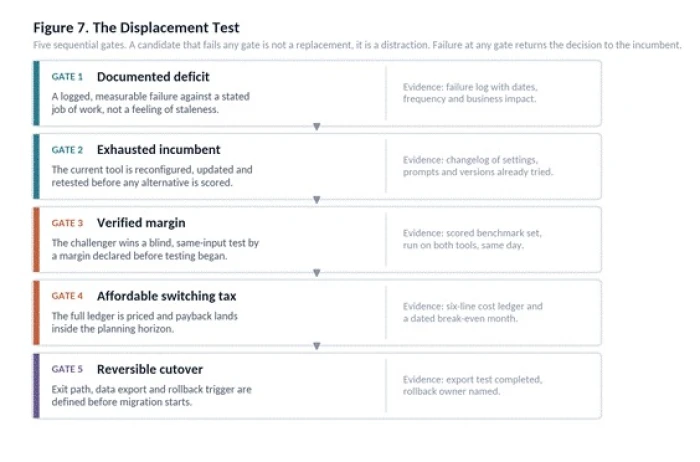
Figure 7. The Displacement Test. The gates run in sequence, and Gate 2 disqualifies more candidate migrations than the other four gates combined.
Gate 1: Documented deficit
Two drift signals, sustained across two review cycles, recorded with dates and business impact. Absent a written failure log, the case is a preference and should be treated as one.
Gate 2: Exhausted incumbent
The cheapest replacement is almost always a reconfiguration. Before any alternative is scored, the incumbent must be retested after a model version upgrade, a prompt and template revision, a settings and plan-tier review, a support escalation, and a written check on the committed roadmap. This gate eliminates more candidate migrations than any other, and it costs a fraction of what the alternatives cost.
Gate 3: Verified margin
The challenger must win a blind test on the frozen benchmark set, run on the same inputs on the same day, by a margin declared in writing before testing begins. Declaring the margin first is what prevents the result from being reinterpreted to fit the conclusion someone already reached.
Gate 4: Affordable switching tax
The full six-line ledger is priced, the break-even month is calculated, and that month falls inside both the planning horizon and the expected service life of the replacement.
Gate 5: Reversible cutover
An export has been tested rather than assumed, a rollback trigger and owner are named, and the conditions that would abort the migration are written down before it starts.
The thirty day parallel run
Gates 3 through 5 are executed inside a fixed evaluation window. Thirty days of shadow operation followed by a staged cutover is enough to expose real behavior without letting the evaluation become a project in its own right.
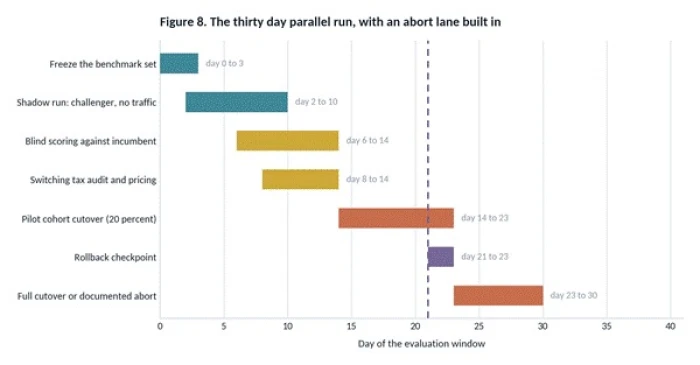
Figure 8. The parallel run protocol. The rollback checkpoint is scheduled before cutover completes, so that abandoning the migration remains an ordinary outcome rather than an admission of failure.
Constructing the benchmark set
The benchmark set is the load-bearing component of the entire method, and it must be built before any alternative is trialed. Thirty to fifty tasks drawn from real work completed in the previous quarter, weighted to actual frequency, and deliberately including the tasks the incumbent currently fails. Once frozen, the set does not change during the evaluation. A benchmark set assembled after a challenger has been seen will unconsciously be shaped to favor it.
Blind scoring
Outputs are stripped of any identifying markers and scored by two reviewers against a written rubric, with disagreements resolved by a third. This is unglamorous and it is the difference between an evaluation and an endorsement. Public leaderboards cannot substitute, because they measure a task distribution that has no particular relationship to the buying team's work.
The abort lane
The rollback checkpoint is scheduled before cutover completes, and it is scheduled deliberately so that abandoning the migration remains an ordinary, expected outcome. Migrations that lack a defined abort point tend to complete regardless of what the evidence says, because by then the switch has acquired advocates.
The six-factor scorecard
Weighted scoring keeps a single impressive dimension from carrying a decision it cannot support. Weights below are a defensible default and should be adjusted to the workload, provided the adjustment happens before scoring rather than after.
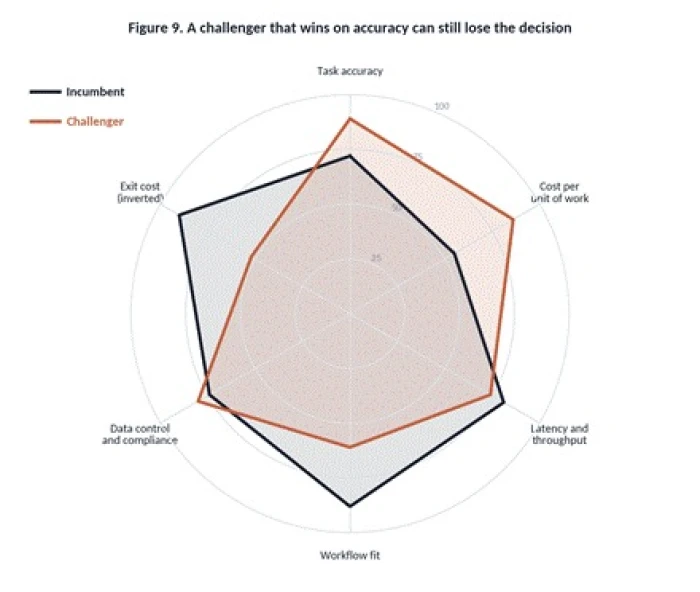
Figure 9. A worked comparison on the six-factor scorecard. The challenger leads on accuracy and unit cost yet trails on workflow fit and exit cost, which is the exact profile that produces a regretted migration.
Figure 9 sets a challenger against an incumbent across those six factors. At first glance it looks like a clear win: the challenger leads task accuracy by seventeen points and unit cost by thirty one. Whether that amounts to a case depends entirely on how the factors are weighted.
| Factor | Weight | How it is scored |
| Task accuracy | 30 percent | Rubric score on the frozen benchmark set, blind, two reviewers |
| Cost per unit of work | 20 percent | Fully loaded, including retries, failed generations and human review time |
| Workflow and integration fit | 15 percent | Net steps added to or removed from the existing documented process |
| Data control and compliance | 15 percent | Mandatory controls scored pass or fail before weighting is applied |
| Latency and throughput | 10 percent | p95 measured under realistic concurrency, not single-request testing |
| Exit cost, inverted | 10 percent | Estimated days to leave, scored inversely so that portability earns points |
Table 3. The six-factor scorecard. Compliance is scored pass or fail first, because a weighted average can otherwise hide a disqualifying gap.
Applying the weights, the challenger scores 77.7 against the incumbent's 74.0, a margin of 3.7 points. Under a Gate 3 threshold of ten weighted points, that fails. The gains are real, but they are concentrated in factors that carry less weight than the workflow disruption and exit exposure they would introduce. The correct verdict is to renegotiate, stage a partial adoption behind an abstraction layer, and retest in two quarters.
Nine triggers that are not reasons
Roughly as much value comes from disqualifying bad cases quickly as from validating good ones. The following recur constantly and none of them survives Gate 1.
| Apparent trigger | Why it fails as a replacement case |
| A leaderboard movement | Public benchmarks measure a task distribution with no established relationship to the buying team's work |
| A striking demo | Demos run on optimized inputs; the frozen benchmark set runs on real ones |
| A competitor's announcement | A competitor's stack carries no information about this team's workflow, data or constraints |
| A single bad output | Output variance is a property of the technology, not a defect signal, until it is measured across a sample |
| A price increase in isolation | Renegotiation costs nothing and frequently resolves it, and Gate 2 requires the attempt first |
| Team boredom or novelty appetite | A real morale issue, but one answered with a training budget rather than a migration budget |
| A feature the incumbent has announced | Comparison should run against the incumbent's committed roadmap, with dates in writing |
| Consolidation for its own sake | Fewer vendors is not automatically cheaper once workflow fit and exit cost are priced honestly |
| A discipline problem in disguise | Process failures do not become fixable by changing the tool that executes the process |
Table 4. Nine false triggers, each of which fails at Gate 1 or Gate 2 of the Displacement Test.
Category guidance
Thresholds shift by category, largely because switching taxes do. The table below gives working defaults for the eight most common AI tool classes.
| Category | Replace when | Hold when | Typical payback |
| Chat and general assistants | A blind margin above 15 points persists across two testing rounds | The difference sits inside normal output variance | 1 to 3 months |
| Image and video generation | Style or control requirements stay unmet after prompt and setting exhaustion | Output variety still carries value; run both instead of choosing | Immediate to 2 months |
| Transcription and meeting notes | Error rate on domain vocabulary exceeds the tolerable review burden | The accuracy gap is under three points | 2 to 4 months |
| Writing and editorial suites | Rework exceeds 15 percent of production time for two consecutive months | The failure traces to briefs and process rather than the tool | 4 to 9 months |
| Coding assistants | Suggestion acceptance falls below the team threshold, or repository context handling blocks real work | The gap is model choice, which is often a setting rather than a vendor | 6 to 12 months |
| Retrieval and search pipelines | Grounding quality or data residency requirements cannot be met in place | The deficit is in chunking, indexing or evaluation, all fixable in place | 12 to 24 months |
| Fine-tuned models | The base generation has moved far enough that retuning beats maintaining | Tuning still outperforms the newest base model on the frozen set | 12 to 30 months |
| Embedded agent platforms | A mandatory control fails, or a load-bearing capability is deprecated | Almost every other case; stage through an abstraction layer instead | 18 to 36 months |
Table 5. Category defaults. Payback ranges assume the switching taxes modeled in Figure 5.
Governance, contracts and the exit clause
Most of the leverage in a replacement decision is created long before the decision arrives, and it is created in the contract.
1. Calendar the review ninety to one hundred twenty days before renewal, which is the window in which renegotiation has leverage and migration still has runway.
2. Negotiate export rights in machine-readable form covering prompt libraries, conversation history, evaluation logs and any tuning artifacts that can legally move.
3. Require a written notice period for model deprecation. A capability withdrawn on thirty days notice converts a considered decision into a forced one at the worst possible moment.
4. Test the export quarterly rather than assuming it works. An untested export clause is a hope, and the discovery that it silently drops metadata belongs in a scheduled test, not in a migration.
5. Maintain an inventory. Replacement decisions cannot be made about tools nobody has recorded, and unmanaged adoption is the norm rather than the exception. One security analysis found that seventy one percent of AI tools put enterprise data at risk, while IBM reported that one in five organizations experienced a breach involving unmanaged AI use, adding roughly 670,000 dollars to breach costs.
Measuring the decision after the fact
A replacement decision is not finished at cutover. Three scheduled checkpoints convert each migration into evidence that makes the next one cheaper to decide.
| Checkpoint | Leading indicators | Lagging indicators |
| Day 30 | Adoption rate, support ticket volume, count of new workarounds | Output volume measured against the pre-migration baseline |
| Day 90 | Hours to competence actually observed, rework hours per week | Cost per completed unit of work, blind quality scores |
| Day 180 | Retention of the new workflow, benchmark set re-run result | Realized payback against the modeled break-even month |
Table 6. Post-migration review schedule. The day 180 comparison against the modeled break-even is the step almost always skipped.
The organizations that decide well are not the ones with better instincts. They are the ones holding a written history of what past replacements cost and returned, which is the only asset that makes the twentieth decision cheaper than the first.
The short answer
The verdict, in one paragraph • Replace one AI tool with another when a documented deficit persists after the incumbent has been genuinely exhausted, when a challenger wins a blind test on real tasks by a margin declared before testing began, when the fully priced switching tax repays inside the expected service life of the replacement, and when the cutover can be reversed. Hold in every other case, and spend the difference on portability, because the next replacement question is already on its way. |