The thirty-day cliff that product forecasts keep ignoring
Acquisition has rarely been easier than it is for an AI tool. A short demo clip travels across social platforms without paid distribution, a generous free tier removes the last objection, and a payment method gets entered in under ninety seconds. Retention has rarely been harder. The exact properties that make an AI product frictionless to adopt, namely zero setup, no data migration, no procurement cycle and no team consensus, make it equally frictionless to abandon.
The commercial shape of the category is unusual and worth stating plainly. AI-powered apps sustain a 41 percent Year 1 realised lifetime value premium over non-AI apps, at a median of $30.16 per payer against $21.37. Those same AI monthly plans retain 36 percent worse over twelve months. Buyers are demonstrably willing to pay more to try an AI tool. They are not staying long enough to justify the price.
Abandonment around day thirty is usually recorded in dashboards as a single event called churn. It is not one event. Five separate failures converge on the same visible outcome, each with its own trigger, its own window inside the month, and its own remedy. Retention programmes fail on AI products largely because they treat all five as a pricing problem, and pricing is only the last of them.
Key findings at a glance ▪ AI monthly subscription plans retain 36 percent worse over twelve months than non-AI apps, despite generating 41 percent higher realised lifetime value. ▪ Median productivity applications hold 32.86 percent of installs at Day 1 and 9.63 percent at Day 30, a 71 percent decline inside a single month. ▪ 55.4 percent of all three-day trial cancellations happen on Day 0, and 84 percent occur before the end of Day 1. ▪ Month one accounts for 35 percent of every annual subscription cancellation, and roughly 72 percent of annual subscribers now cancel inside year one. ▪ Two-thirds of surveyed developers name near-correct output as their top frustration, and 45 percent report losing significant time debugging AI output. ▪ Only 5 percent of organisational AI initiatives reach production with measurable impact, against 80 percent that begin exploration. |
How steep is the drop-off, and is it specific to AI?
Context matters before assigning blame. Steep first-month attrition is normal across consumer software, and an AI product that loses most of its installed base by Day 30 is not automatically underperforming. The question is whether AI tools decay faster than comparable categories, and the answer is yes, but only after the first paid cycle.
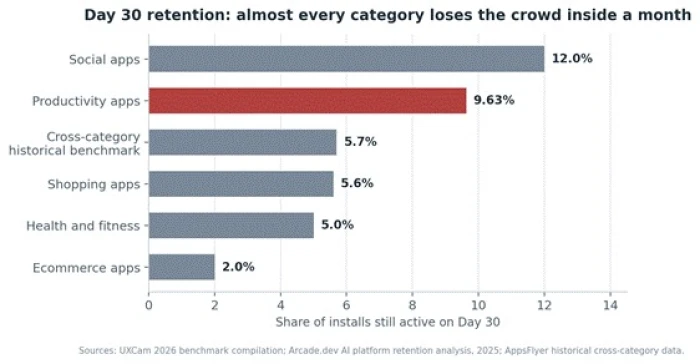
Figure 1. Day 30 retention across major app categories. Productivity applications, the closest structural analogue to most AI assistants, sit near the top of a low range.
Productivity applications, the closest structural comparison for most AI assistants and writing tools, hold 32.86 percent of installs at Day 1 and 9.63 percent at Day 30. The frequently quoted cross-category benchmark of roughly 25 percent Day 1 and 6 percent Day 30 traces back to research published in 2020 and 2021, so it functions as historical orientation rather than a current target. Category medians published for 2026 range from about 12 percent Day 30 for social apps down to 2 percent for ecommerce.
Plotting the decay reveals two windows that absorb almost all of the loss, and neither of them sits near day thirty.
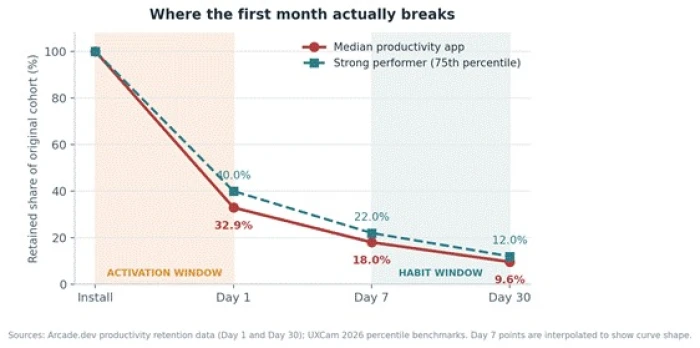
Figure 2. The retention curve collapses in the first twenty-four hours, then bleeds through the habit-formation window. By the time a renewal notice appears, the outcome was decided weeks earlier.
The first window closes within hours of install. The second closes somewhere between Day 5 and Day 20, when a tool either becomes part of a recurring task or becomes a browser tab that never gets reopened. Cancellation on Day 29 is an administrative act. The decision behind it was taken far earlier, which is why win-back campaigns timed to the renewal notice consistently underperform.
The AI-specific penalty appears after the novelty period, not during it
Aggregated data covering more than 115,000 subscription apps and over $16 billion in tracked revenue shows a clean split between monetisation and durability for AI products.
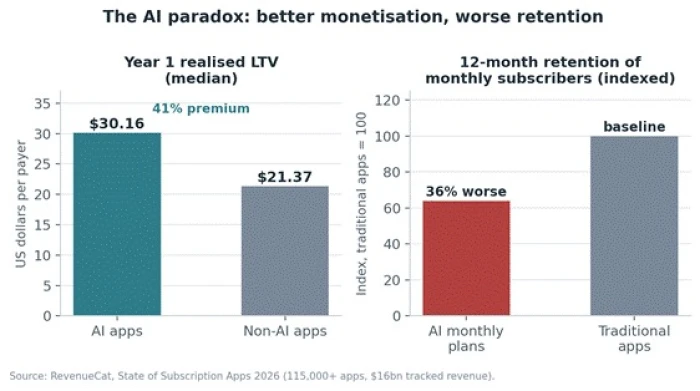
Figure 3. AI apps monetise better and retain worse. The gap is a recent development rather than a structural constant.
The historical comparison is the important part. In the previous reporting year, AI apps showed twelve-month payer retention of 9.2 percent on the App Store and 11.5 percent on Google Play, broadly comparable to traditional apps in the same categories. The sharp divergence emerged only once AI tools moved into the mainstream and users had accumulated enough months to form a judgement. That timing points away from a novelty explanation and toward an evaluation one. Users are not getting bored. They are finishing an assessment and concluding the tool does not earn its recurring cost.
The Retention Fracture Model: five break points in thirty days
Diagnosing first-month abandonment requires separating failures that look identical in a cancellation report. The framework below organises them by the window in which each occurs, because the timing of a drop-off is the strongest available clue to its cause.
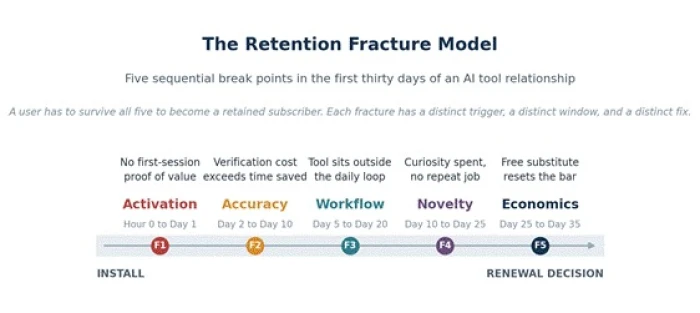
Figure 4. The Retention Fracture Model. A subscriber has to clear all five fractures to reach month two, and each one has a distinct diagnostic signature.
| Fracture | Window | What actually fails | Observable signal |
| F1 Activation | Hour 0 to Day 1 | The user never reaches a first result worth having | Session 1 ends without a completed core action; trial cancelled same day |
| F2 Accuracy | Day 2 to Day 10 | Checking the output costs more than doing the task | Rising regeneration and edit rates; short sessions with abandoned outputs |
| F3 Workflow | Day 5 to Day 20 | Output has to be moved by hand into the real system of record | High copy-paste exits; no integration connected; usage confined to one surface |
| F4 Novelty | Day 10 to Day 25 | Exploratory curiosity is spent and no recurring job replaced it | Prompt diversity collapses; session count falls without a drop in satisfaction scores |
| F5 Economics | Day 25 to Day 35 | A free or bundled substitute resets the reference price | Downgrade views, pricing page visits, cancellation surveys citing cost |
Table 1. The five fractures, their windows, and the telemetry that distinguishes them.
Fracture one: activation, where value is never actually proven
The single most consequential finding in current subscription data concerns how quickly trial users decide. Exactly 55.4 percent of all three-day trial cancellations occur on Day 0, and 84 percent occur between Day 0 and the end of Day 1. The share cancelling on Day 0 rose from roughly 51 percent the previous year, so the instinct is sharpening rather than softening.
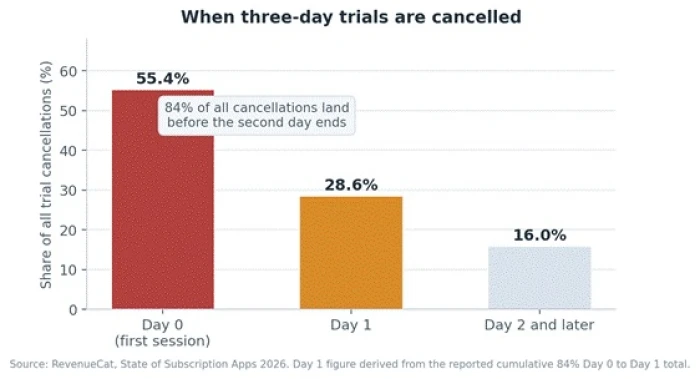
Figure 5. A three-day trial is functionally a one-hour trial. Most subscribers subscribe to get past the paywall, assess the core feature immediately, then switch off auto-renewal.
The behaviour underneath the number is worth stating precisely, because it changes what onboarding is for. Users subscribe in order to see what sits behind the paywall, evaluate the core capability inside the first session, and then pre-emptively cancel to avoid a charge. Auto-renewal gets switched off while the app is still open. Any onboarding sequence built on the assumption that a subscriber will explore features across three days is designing for a user who no longer exists.
Trial length and paywall design compound the problem
Two further findings sit awkwardly against each other. Trials running 17 to 32 days convert at a median of 42.5 percent, against 25.5 percent for trials under four days, a roughly 70 percent advantage for the longer format. Yet 46.5 percent of apps now use trials of four days or less, up from 42.1 percent a year earlier. Cash flow pressure and faster experiment cycles push teams toward short trials, and short trials push users toward instant judgement.
Paywall structure pulls in the opposite direction. Hard paywalls deliver a median Day 35 trial-to-paid conversion of 10.7 percent against 2.1 percent for freemium, and generate roughly eight times the revenue per install at Day 60. Long-run retention between the two models is close to identical, at 28 percent of yearly subscribers for freemium against 27 percent for hard paywall. The combination that produces the worst first-month outcome is a hard paywall attached to a short trial and an onboarding flow that explains rather than demonstrates.
| Design decision | Reported outcome | Effect on month one |
| Hard paywall | 10.7 percent Day 35 trial-to-paid, against 2.1 percent freemium | Higher intake, but every subscriber arrives in evaluation mode from minute one |
| Trial under 4 days | 25.5 percent conversion | Forces a same-session verdict; amplifies Day 0 cancellation |
| Trial of 17 to 32 days | 42.5 percent conversion | Allows habit formation before the billing decision |
| Freemium access | 27 to 28 percent yearly subscriber retention, near parity with hard paywall | Slower revenue, comparable durability |
Table 2. Trial and paywall configurations against reported conversion and retention outcomes. Source: RevenueCat, State of Subscription Apps 2026.
Fracture two: accuracy, and the verification tax nobody priced in
An output that is obviously wrong is cheap. It gets discarded in two seconds and the user moves on. An output that is almost right is expensive, because the error is only discoverable after review, testing and partial rework. This asymmetry is the central retention mechanic of the AI category, and it is now measurable.
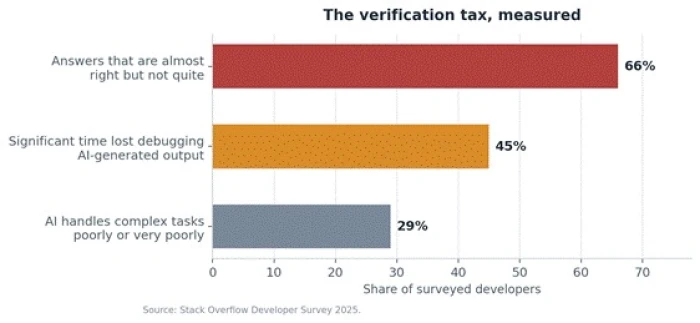
Figure 6. Near-correct output is the leading complaint among surveyed developers, ahead of outright failure. Verification cost, not capability, is the friction that accumulates across a first month.
In a survey of more than 49,000 developers across 177 countries, 66 percent named answers that are almost right but not quite as their top frustration, and 45 percent reported losing significant time debugging AI-generated code. The pattern generalises well beyond software, because every knowledge task carries the same structure: the tool produces something plausible, the human has to establish whether it is correct, and the cost of establishing that scales with how plausible the output looks.
Trust has moved accordingly, in the opposite direction to adoption.
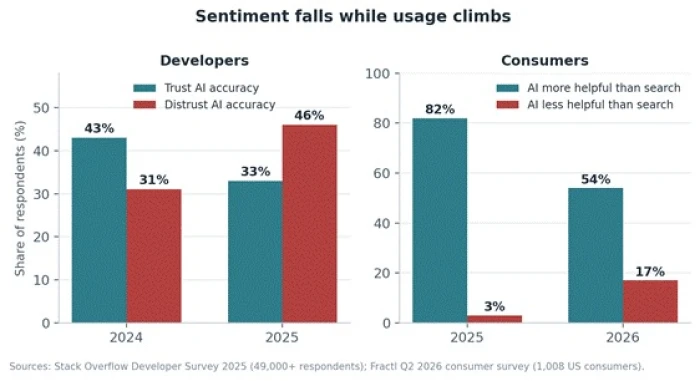
Figure 7. Developer and consumer sentiment both deteriorated while usage rose. Falling trust does not stop usage; it stops willingness to pay for it.
Among developers, trust in AI accuracy fell from 43 percent to 33 percent in a single year while distrust rose from 31 percent to 46 percent, and favourable sentiment slid from above 70 percent to 60 percent. Adoption over the same period climbed from 76 percent to 84 percent. Among consumers, a survey of 1,008 respondents found that the share rating AI as more helpful than traditional search fell from 82 percent to 54 percent year on year, while the sceptic segment expanded from 3 percent to 17 percent.
A randomised controlled trial run by METR on 16 experienced open-source developers across 246 real tasks measured a 19 percent slowdown when AI tools were permitted, while the same developers estimated afterwards that AI had made them about 20 percent faster. METR has since flagged selection effects in follow-up work and now treats the original result as historical rather than settled, so it should not be read as a general verdict on AI productivity. The finding that survives the caveat is narrower and more useful for retention analysis: self-reported speed and measured speed can point in opposite directions, which means early enthusiasm scores are a poor predictor of month-two behaviour.
Why this fracture shows up in week two, not week one ▪ First-session tasks are usually simple and easy to verify, so the verification tax is invisible. ▪ By day five the user has moved to real work with real stakes and real edge cases. ▪ Each near-correct output adds review time that was not present in the pre-AI workflow. ▪ The user does not conclude the tool is bad. The user concludes it is not saving time, which is a harder objection to reverse. |
Fracture three: workflow, where the tool never enters the daily loop
A tool that produces good output but sits outside the system of record imposes a permanent tax of manual transfer. Every generated result has to be copied, reformatted and pasted into the document, ticket, spreadsheet or inbox where the work actually lives. That transfer cost is small per instance and fatal in aggregate, because it is paid on every single use and it never declines with familiarity.
The organisational version of this failure has been quantified more rigorously than the consumer one. Research from the MIT Media Lab NANDA initiative, covering more than 300 public deployments, 150 executive interviews and 350 employee surveys, describes a funnel that narrows sharply at the integration stage.
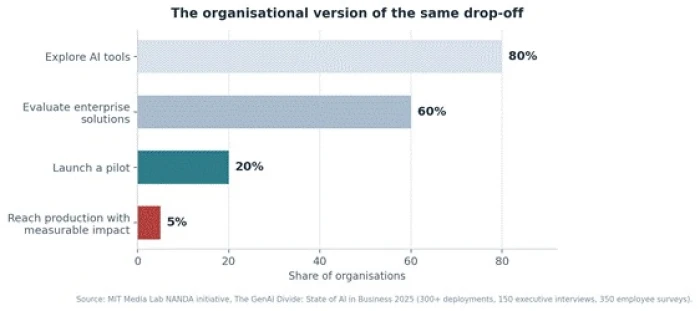
Figure 8. Organisational adoption of AI narrows most severely between pilot and production. The reported cause is integration and learning, not model quality.
Roughly 80 percent of organisations explore AI tools, 60 percent evaluate enterprise solutions, 20 percent launch a pilot, and about 5 percent reach production with measurable impact. The research attributes the gap to what it calls a learning gap: tools that cannot retain feedback, adapt to context or improve with use, deployed into workflows that were never restructured to accommodate them. Notably, the same research records that employees at over 90 percent of surveyed firms use personal AI tools even where the sanctioned pilot has stalled, which indicates the failure is one of fit rather than appetite.
Speed of integration correlates with survival. Mid-market organisations reported moving from pilot to full implementation in roughly 90 days, against nine months or longer for large enterprises. The consumer equivalent of a nine-month integration is a tool that never gets connected to anything, and the outcome is identical.
| Integration depth | Typical transfer cost per use | Observed first-month outcome |
| Standalone chat surface | Full manual copy, reformat and paste | Highest abandonment; usage concentrated in exploratory prompts |
| Browser extension or side panel | Partial manual transfer | Moderate retention; survives only where the host surface is already a daily habit |
| Native integration into the system of record | Near zero | Strongest retention; the tool is used because not using it costs effort |
| Agentic execution inside the workflow | Near zero, with added verification burden | High retention where accuracy holds, sharp collapse where it does not |
Table 3. Integration depth against transfer cost and first-month durability.
Fracture four: novelty exhaustion and the missing recurring job
Curiosity is a finite budget, and AI tools are unusually good at spending it quickly. During the first week, most prompts are tests rather than tasks. The user asks the tool to write a limerick, summarise a famous document, draft a difficult email that will never be sent, and generally probes the boundaries of the capability. These sessions register as engagement in every analytics dashboard, which is precisely why they are dangerous.
The diagnostic signature of this fracture is a collapse in prompt diversity that precedes a collapse in session count. A retained user narrows toward two or three recurring jobs and repeats them. An abandoning user never narrows at all, because no recurring job was ever found, and then simply stops. Satisfaction scores frequently stay high through this period, since the tool was impressive during exploration. Positive sentiment alongside falling frequency is one of the more reliable predictors of a cancellation in the following fortnight.
Consumer purchasing behaviour has adapted to this pattern rather than resisting it. Survey data indicates that Americans pay for an average of four premium AI subscriptions at roughly $66 a month, and that 53 percent cancel and restart AI tools as needed. That is not abandonment in the traditional sense. It is deliberate intermittent consumption, in which a tool is treated as a utility to be switched on for a project and switched off afterwards. For a subscription business, the accounting effect is the same, but the remedy differs entirely: the goal shifts from preventing cancellation to making reactivation trivial and making the pause option visible before the cancel button gets pressed.
Fracture five: economics, substitution and subscription fatigue
Price objections are recorded last and diagnosed first, which is the wrong order. Cost is the most socially acceptable answer on a cancellation survey and consequently absorbs several unrelated problems: genuine price-to-value mismatch, a billing date that arrived earlier than expected, a competitor promotion, and simple redundancy. Only the first of these is solved by a discount.
Annual plans, long treated as insurance against churn, no longer function that way.
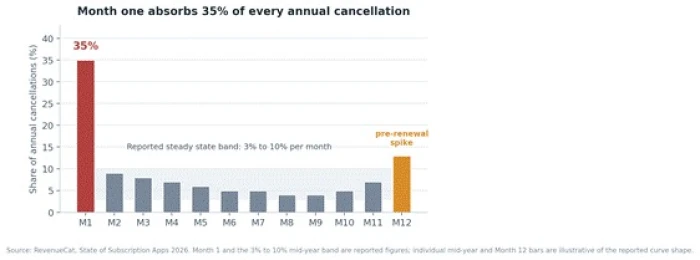
Figure 9. Annual subscribers do not grant twelve months of goodwill. Auto-renewal gets switched off during the first billing cycle, well before the product has had time to prove itself.
Month one accounts for 35 percent of all annual cancellations. After that spike, cancellations settle into a band of 3 to 10 percent per month before rising again ahead of renewal. The overall picture deteriorated sharply year on year: roughly 56 percent of annual subscribers cancelled within year one in the previous reporting period, rising to about 72 percent in the current one. The battle for year two is fought in week one, not month eleven.
Feature homogenisation has made substitution nearly costless
When generative capability first arrived, individual tools served distinct functions. That distinction has largely dissolved. A word processor generates images, a spreadsheet drafts summaries, a chat assistant writes code, and a general assistant absorbs the specific use case that justified a separate subscription. Every bundled AI feature shipped inside an existing paid product resets the reference price for standalone tools performing the same job.
Subscription fatigue amplifies the effect. United States households now spend roughly $273 a month on subscriptions, and around 89 percent of consumers underestimate that total. When the true figure surfaces, usually through an audit prompted by a bank alert or a subscription manager app, the newest and least habitual line items are cut first. A thirty-day-old AI subscription with three sessions logged is the easiest cut on the list.
Involuntary churn is a meaningful and fixable share of the total
Not every cancellation is a decision. On Google Play, 31 percent of all subscription cancellations stem from billing failures, against 14 percent on the App Store, and the Google Play figure worsened from 28.2 percent a year earlier. For products with a substantial Android base, roughly a third of recorded churn reflects an expired or declined card and inadequate retry logic rather than a verdict on the product. Improved dunning and grace periods have been reported to recover 15 to 20 percent of lost revenue without any new acquisition.
Where first-month abandonment actually originates
No published dataset attributes AI churn cleanly across all five fractures, because the required telemetry sits inside individual products rather than in aggregated benchmarks. The weighting below is a composite estimate derived from the studies cited throughout this analysis, offered as a diagnostic starting point rather than a measured distribution. It will shift materially by category and price point: activation dominates in low-priced consumer apps, while workflow and accuracy dominate in higher-priced professional tools.
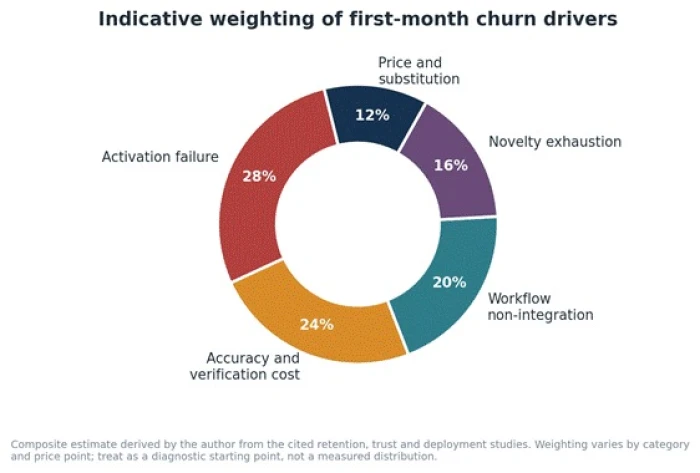
Figure 10. Indicative weighting of first-month churn drivers across the AI tool category. Products should replace these weights with their own instrumented values.
A day-by-day diagnostic for the first thirty days
Because each fracture occupies a distinct window, the timing of a drop-off is itself diagnostic. The table below maps the observable signal to the underlying failure and to the intervention that addresses it.
| Window | Warning signal | Likely fracture | Intervention that fits |
| Hour 0 to Hour 1 | Session ends with no completed core action | Activation | Compress onboarding to a single guided task that produces a keepable result |
| Day 0 to Day 1 | Auto-renewal switched off while the session is still open | Activation | Move the strongest capability in front of the paywall; extend trial length |
| Day 2 to Day 7 | Regeneration rate rising, outputs abandoned mid-flow | Accuracy | Add sourcing, confidence signals and inline correction rather than more capability |
| Day 5 to Day 14 | High copy-out volume, no integration connected | Workflow | Ship the two integrations that cover the majority of destination surfaces |
| Day 7 to Day 20 | Prompt diversity narrowing without a repeated job emerging | Novelty | Prompt the user toward a recurring use case tied to a real calendar event |
| Day 10 to Day 25 | Session count falling while satisfaction scores stay high | Novelty | Trigger value reinforcement showing accumulated output and time saved |
| Day 20 to Day 30 | Pricing page and downgrade views spiking | Economics | Offer a pause and a lower tier before the cancellation flow, not inside it |
| Any point, Android | Cancellation with no preceding drop in usage | Involuntary | Fix billing retry logic and enable grace periods |
Table 4. First-month diagnostic map linking observable telemetry to the underlying fracture.
What durable AI products do differently in month one
Products that survive the first month share a small number of structural choices rather than a long list of tactics. The pattern is consistent across the strongest performers in the available data.
▪ Time to first useful result is measured in seconds and treated as the primary retention metric, ahead of activation rate or session length.
▪ The first session produces an artefact the user keeps, sends or ships, because a retained output creates a reason to return that a demonstration never does.
▪ Verification is designed into the interface through sourcing, confidence indication, structured diffs and easy partial correction, so the review burden falls rather than accumulating.
▪ Integration with the destination surface ships before additional model capability, because transfer cost compounds on every use while capability is only visible on some.
▪ Onboarding steers the user toward one recurring job rather than showcasing breadth, since breadth is what novelty exhaustion consumes.
▪ Value reinforcement runs continuously through the first two billing cycles rather than being triggered by the cancellation flow.
▪ A pause option and a lower tier are visible before cancellation, which converts a permanent loss into an intermittent relationship consistent with how the category is actually consumed.
▪ Billing infrastructure receives engineering attention proportional to the roughly one third of Android cancellations it causes.
Segment differences worth respecting
| Segment | Dominant fracture | Strongest available lever |
| Consumer mobile, under $10 per month | Activation and novelty | First-session artefact; visible pause option; longer trial |
| Prosumer and creator, $10 to $40 per month | Accuracy and workflow | Verification design; integrations into the destination surface |
| Professional and technical, above $40 per month | Accuracy and workflow | Reliability on edge cases; memory and context retention across sessions |
| Team and organisational deployment | Workflow and learning gap | Restructured process, not added features; fast pilot to production cycles |
Table 5. Dominant fracture and highest-leverage response by segment.
Conclusion: in this category, the first month is the product
The evidence points to a conclusion that is uncomfortable for teams organised around model capability. Abandonment after the first month is rarely caused by the model being insufficiently capable. It is caused by a first session that proved nothing, a verification burden that quietly cancelled the time savings, an output that had to be carried by hand into the place where the work lives, a set of exploratory prompts that never resolved into a repeated job, and a bundled substitute that arrived free inside software already being paid for.
Each of those failures is a product and design problem with a known window and a known remedy. None of them is solved by a discount at the cancellation screen, and none of them is visible in a dashboard that reports only monthly churn. The category currently monetises better than any comparable software segment and retains worse, and that gap will close in one direction or the other. It will close favorably only for the products that treat the first thirty days as the deliverable rather than as the onboarding period that precedes it.