The Question Is No Longer About Twenty Dollars
Four of the most widely used AI subscriptions now sit within one cent of each other. ChatGPT Plus is $20 per month. Claude Pro is $20. Google AI Pro is $19.99. Perplexity Pro is $20. At the standard tier, price has stopped being a differentiator, which means the choice between one powerful tool and several smaller ones cannot be settled by comparing sticker prices.
Survey data suggests most buyers never consciously made the choice at all. Bango's study of 2,000 paying American AI users found that the average subscriber pays close to $66 per month across four separate AI tools. Nearly a quarter spend more than $100 per month, and 14 percent pay for eight or more services. Just over half report canceling and restarting AI tools as needed, which makes churn the default management strategy rather than the exception.
That $66 figure is the real starting point for this analysis. It is more than three times the price of a single flagship plan, and it was reached one $20 decision at a time.
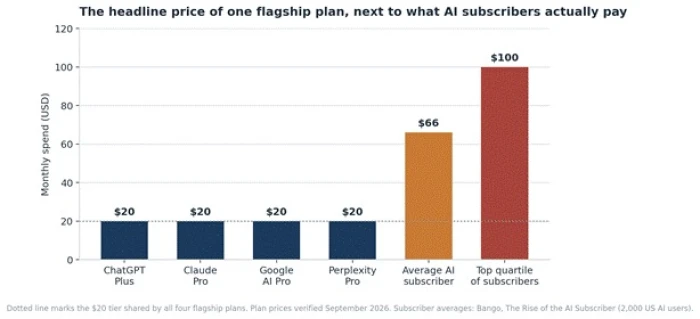
Figure 1. The gap between a single flagship subscription and reported multi tool spend. Plan prices verified September 2026; subscriber averages from Bango, The Rise of the AI Subscriber.
What Purchasing Data Says About How AI Is Actually Bought
Business spending records point in the same direction as the consumer survey. Ramp, which tracks card and invoice data across roughly 70,000 businesses, reported that paid AI adoption crossed 50 percent of businesses in March 2026 and has kept climbing toward saturation since.
By July 2026, 43.5 percent of American businesses paid Anthropic, 39.7 percent paid OpenAI and 4 percent paid xAI, with a further 6.1 percent of AI-using businesses buying open source model access through serving platforms. Those shares overlap heavily, and Ramp has measured the overlap directly: roughly 79 percent of Anthropic's business customers also pay OpenAI. Stacking is already the norm at the vendor level.
| Metric | Value | Period | Source |
| US businesses paying Anthropic | 43.5% | July 2026 | Ramp AI Index |
| US businesses paying OpenAI | 39.7% | July 2026 | Ramp AI Index |
| US businesses paying xAI | 4.0% | July 2026 | Ramp AI Index |
| AI users on open source serving platforms | 6.1% | July 2026 | Ramp AI Index |
| Anthropic customers who also pay OpenAI | 79% | Early 2026 | Ramp AI Index |
| Median AI spend per employee | $11.95 | July 2026 | Ramp AI Index |
| Top decile AI spend per employee | $650 | July 2026 | Ramp AI Index |
| Top percentile AI spend per employee | $7,400 | July 2026 | Ramp AI Index |
Table 1. Business AI adoption and spending intensity. Adoption shares overlap because most buyers pay more than one vendor.
The spread in that final block matters more than the averages. A median firm spending under twelve dollars per employee and a top percentile firm spending $7,400 per employee are not solving the same problem, and no single recommendation fits both.
What One Flagship Plan Buys in 2026
The case for consolidation rests on a simple observation: the bundle inside a single subscription has widened faster than most buying habits have adjusted. Capabilities that required separate products two years ago now ship inside the standard tier.
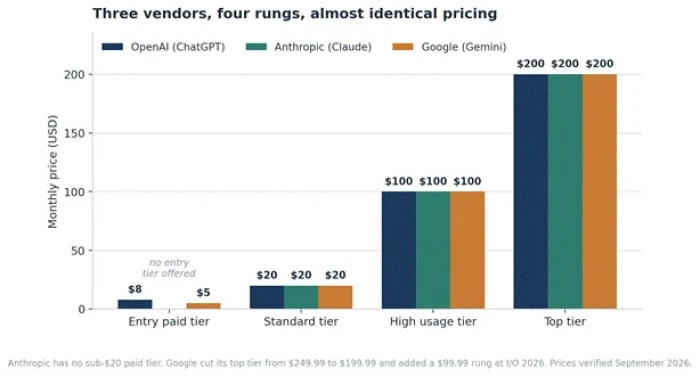
Figure 2. Consumer price ladders for the three largest AI vendors, verified September 2026.
| Vendor | Entry paid | Standard | High usage | Top tier | Team or seat pricing |
| OpenAI (ChatGPT) | Go, $8 | Plus, $20 | Pro, $100 | Pro, $200 | Business, $25 monthly or $20 annual |
| Anthropic (Claude) | None | Pro, $20 | Max 5x, $100 | Max 20x, $200 | Team, $25 monthly or $20 annual |
| Google (Gemini) | AI Plus, $4.99 | AI Pro, $19.99 | AI Ultra, $99.99 | AI Ultra, $199.99 | Workspace seats, separate |
| Perplexity | None | Pro, $20 | Not offered | Max, $200 | Enterprise Pro, $40 per seat |
Table 2. Published consumer and small team pricing in USD per month, verified 5 September 2026.
Price movement over the past year has run in the buyer's favor. Google reduced its top AI Ultra tier from $249.99 to $199.99 at I/O 2026 and introduced a new $99.99 rung; its entry plan fell from $7.99 to $4.99 in June 2026. OpenAI inserted a $100 Pro tier below the $200 plan in April 2026 and cut Business seats by $5 in the same month. Anthropic prices Pro at $20 with an annual equivalent of about $17.
What sits inside the standard tier
| Capability | Included at the $20 tier | Point tool it displaces |
| Frontier reasoning model | Yes, on all three major vendors | Nothing, this is the core product |
| Image generation | Yes, ChatGPT includes it with Plus | Entry image subscriptions from $10 |
| Deep research with citations | Yes, on ChatGPT, Claude and Google AI Pro | Research tools from $10 to $20 |
| Document and spreadsheet analysis | Yes, with expanded upload limits | Document chat tools from $5 to $20 |
| Code assistance and agents | Yes, Claude Pro includes Claude Code | Editor subscriptions around $20 |
| Video generation | Partial, Google AI Pro opens Veo | Video plans from $10 to $95 |
| Projects, memory and saved context | Yes | Note and knowledge tools from $8 |
| Writing correction and rewriting | Yes, as a native capability | Grammar tools at $12 to $30 |
Table 3. Capability coverage at the standard tier. Exact feature availability varies by vendor, account and region.
What the Specialist Stack Costs
The counter argument is that specialists go deeper, and the pricing data confirms that depth is affordable at the bottom of each category and expensive at the top. Voice generation starts at $6 per month. Image generation starts at $10. A single search engine optimization suite starts at $129 to $139 and can reach $549 before seats are added.
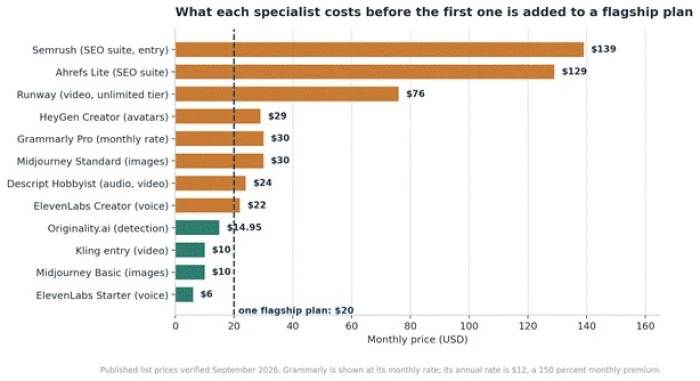
Figure 3. Entry and working tier prices for widely used specialist tools, against the $20 flagship reference line.
| Category | Representative tool | Price ladder (USD per month) |
| Image generation | Midjourney | $10 Basic, $30 Standard, $60 Pro, $120 Mega, about 20 percent off annual |
| Voice and cloning | ElevenLabs | Free tier, $6 Starter, $22 Creator, $99 Pro |
| Video generation | Kling | Free tier, $10, $37, $92, $180 |
| Video generation | Runway | About $76 to $95 for the unlimited tier |
| Avatars | HeyGen | $29 Creator, $49 Pro, $149 Business |
| Audio and video editing | Descript | About $24 Hobbyist, about $33 Professional |
| Writing correction | Grammarly | $12 annual, $30 monthly, $60 quarterly |
| Search optimization | Ahrefs | $29 Starter, $129 Lite, $249 Standard, $449 Advanced |
| Search optimization | Semrush | $139 SEO, $199 Starter, $299 Pro Plus, $549 Advanced |
| AI detection | Originality.ai | $14.95 for 2,000 credits, no free tier |
Table 4. Published specialist pricing, verified September 2026. Prices exclude tax, seats and credit overages.
Four pricing shapes, only one of which is predictable
Comparing monthly figures across categories hides a structural difference. Specialist tools are sold in four shapes, and the shape determines whether the invoice can be forecast at all.
Flat per seat. Predictable and easy to approve. Assistants still work this way, which is part of why consolidation is easy to budget.
Credits or tokens. The bill follows usage rather than headcount. Rollover is rare, so uneven workloads pay for capacity that expires.
Outcome based. Charged per resolved task or qualified lead. Buyer friendly where it exists, but confined to a few sales and support platforms.
Quote only. No published price. Expect platform fees and seat minimums that make small deployments cost far more per person than large ones.
The rule that survives every category Credit systems reward heavy, regular use and punish spiky use. A specialist bought for an occasional project converts a variable need into a fixed monthly charge, which is precisely the pattern that produces shelfware. |
Four Places a Multi Tool Budget Leaks
Duplicate capability
Consolidation analyses of enterprise software portfolios in 2026 found that AI point solutions carry the lowest utilization rate of any software category, at roughly 38 percent, against about 47 percent for the average enterprise SaaS portfolio. Zylo's 2026 SaaS Management Index, built on more than 40 million licenses and $75 billion in tracked spend, puts overall license utilization at about 54 percent.
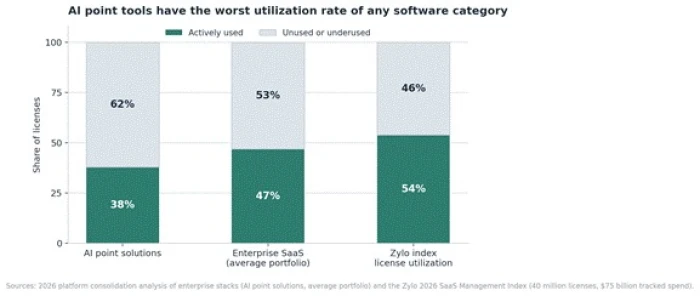
Figure 4. License utilization by category. AI point tools underperform the software portfolio they were added to.
The mechanism is easy to trace. Organizations bought standalone AI tools through 2024 and 2025 while their core platforms were building the same capabilities natively. Recent consolidation research estimates that platform-native AI can now absorb 25 to 35 percent of point solutions without any loss of function.
Shelfware
Waste in software portfolios is measured, not estimated. Zylo reports that organizations leave an average of 36 percent of licenses unused against recommended utilization levels, against median SaaS spend of $9,455 per employee, which works out to roughly $3,400 wasted per employee per year. Vertice, drawing on more than $30 billion of processed spend, splits the problem into 15 percent of applications with zero activity and a further 51 percent underutilized.
Individual buyers are not exempt. In the same Bango survey, 53 percent of American AI subscribers reported canceling and restarting tools as needed, which is a rational response to paying for capacity that sits idle between projects.
The switching tax
The largest cost in a fragmented stack never appears on an invoice. A Harvard Business Review study of 137 workers across three Fortune 500 companies found that the average worker toggles between applications and websites roughly 1,200 times per day, spending close to four hours per week reorienting, or about 9 percent of total work time. A joint Qatalog and Cornell University study measured the recovery cost of a single toggle at about 9.5 minutes to regain productive flow.
Applying that 9.5 minute figure to the additional switches created by splitting one workflow across separate tools produces a cost that dwarfs every subscription in the stack.
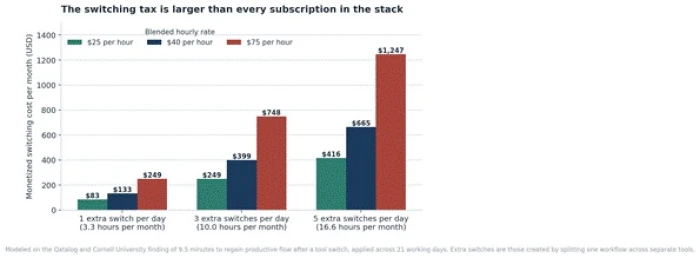
Figure 5. Monetized switching overhead across 21 working days, modeled at three switching rates and three hourly rates.
| Extra switches per working day | Hours lost per month | At $25 per hour | At $40 per hour | At $75 per hour |
| 1 | 3.3 | $83 | $133 | $249 |
| 3 | 10.0 | $249 | $399 | $748 |
| 5 | 16.6 | $416 | $665 | $1,247 |
Table 5. Switching overhead sensitivity. Even the most conservative row exceeds the cost of four $20 subscriptions.
Billing mechanics
Specialist tools carry a set of costs that the plan card does not advertise. Monthly billing is often penalty pricing: Grammarly lists $12 on annual billing against $30 monthly, a 150 percent premium, and several writing tools price their annual plans at roughly half the monthly rate. Credit allowances typically reset rather than roll over. Seats are frequently extra, with additional Ahrefs seats reported at roughly $40 to $80 each. Some platforms upgrade credit tiers automatically once an allowance is exceeded unless usage based billing is explicitly enabled.
The Consolidation Coefficient Method
Comparing sticker prices produces the wrong answer because it ignores duplication and switching. The Consolidation Coefficient Method reduces the decision to one ratio that can be calculated from a bank statement in about ten minutes.
CC = ( D + S ) / F
| Term | Definition | How to measure it |
| D | Duplicated monthly spend | Sum of every subscription whose primary function already exists inside the flagship plan |
| S | Monetized switching overhead | Extra daily tool switches multiplied by 9.5 minutes, by 21 working days, by the blended hourly rate |
| F | Flagship monthly cost | The single plan that would absorb those functions, normally $20 or $100 |
Table 6. Terms in the Consolidation Coefficient. Reporting the ratio twice, once with S and once without, separates price waste from time waste.
Two readings are useful. The price coefficient uses D alone and answers whether the stack is paying twice for the same capability. The total coefficient adds S and answers whether fragmentation is costing more than the software. A price coefficient below 1 means the stack is cheap relative to the flagship and should be kept. Between 1 and 3, consolidation is worth testing for one billing cycle. Above 3, consolidation is the default and the burden of proof shifts to the specialist.
| Worked case | D | F | Price coefficient | Gate result | Recommended action |
| Solo generalist paying for a research tool, a grammar tool and a paraphraser | $69.95 | $20 | 3.50 | All gates pass | Consolidate to one plan |
| Creative producer paying for image, voice, avatar, editing and video tools | $33.00 | $20 | 1.65 | Craft gate fails on image and voice | Keep two specialists, drop three |
| Technical operator running four standard tier plans to spread usage limits | $0.00 | $100 | 0.00 | Ceiling gate fails | Buy one high usage tier instead |
Table 7. Three worked cases. The coefficient sizes the opportunity; the gates in section 9 decide whether to act on it.
The third case is the important one, because it is the case where the arithmetic favors the stack and the framework still says no. Four standard plans cost $80 per month against $100 for one high usage tier, but the reason the four plans exist is that a single account keeps hitting limits. Spreading a workload across four accounts to dodge a cap solves a billing problem by creating a context problem.
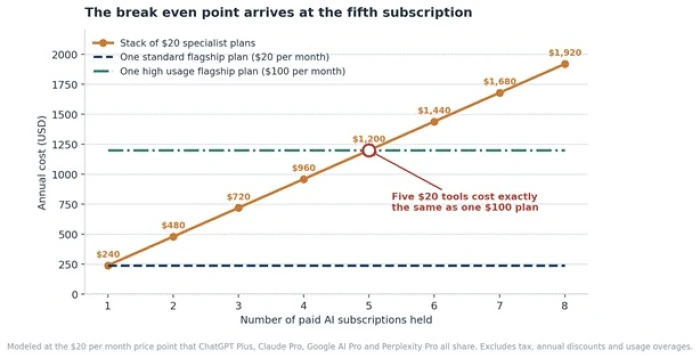
Figure 6. Annual cost as subscriptions accumulate. The fifth $20 tool costs the same as one $100 high usage plan.
Four Buyer Profiles, Four Different Answers
Applied to real workloads, the framework produces different verdicts for different buyers. The models below use published list prices and assume monthly billing.
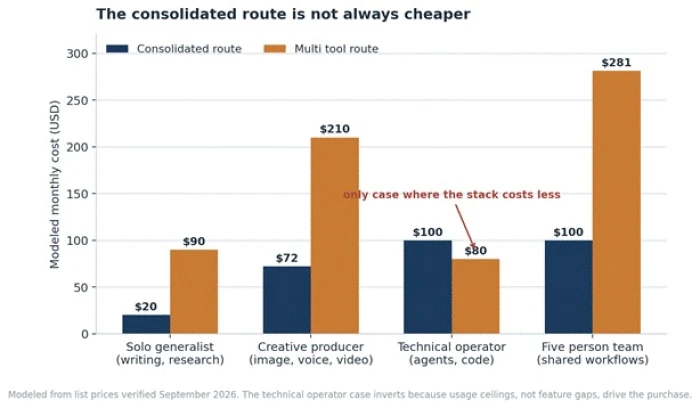
Figure 7. Modeled monthly cost by buyer profile. The consolidated route wins in three of four cases.
| Profile | Consolidated route | Multi tool route | Monthly gap | Annual gap |
| Solo generalist (writing, research, admin) | $20 | $89.95 | $69.95 | $839 |
| Creative producer (image, voice, video) | $72 | $210 | $138 | $1,656 |
| Technical operator (agents, code, volume) | $100 | $80 | Stack is $20 lower | Stack is $240 lower |
| Five person team (shared workflows) | $100 | $281 | $181 | $2,172 |
Table 8. Modeled spend by profile, USD, list prices verified September 2026.
Profile composition
Solo generalist. Consolidated: one flagship at $20. Multi tool: flagship $20, research tool $20, grammar tool $30 monthly, paraphraser $19.95.
Creative producer. Consolidated: flagship $20, Midjourney Standard $30, ElevenLabs Creator $22. Multi tool adds HeyGen Creator $29, Descript Professional $33 and Runway at $76.
Technical operator. Consolidated: one high usage tier at $100. Multi tool: four standard plans at $20 each, held mainly to spread usage limits.
Five person team. Consolidated: five team seats on annual billing at $20 each. Multi tool adds Midjourney Standard $30, ElevenLabs Creator $22 and Ahrefs Lite $129 as shared accounts.
The pattern across all four profiles Consolidation wins wherever the second tool duplicates a capability. It loses only where the constraint is volume rather than function, and in that single case the correct response is still one vendor, bought a rung higher, rather than several accounts bought sideways. |
Where Several Smaller Tools Genuinely Win
A framework that always returns the same answer is not a framework. There are four conditions under which the specialist stack is the better purchase, and each is observable rather than a matter of taste.
Control that the flagship does not expose
Depth is usually a matter of controls rather than raw output quality. Midjourney gates private generation behind its $60 Pro tier, which matters for client work because output on lower tiers is publicly visible in the gallery. ElevenLabs includes instant voice cloning on its $6 Starter plan while Murf reportedly reserves cloning for enterprise contracts in the $1,000 to $5,000 range per year. Those are structural differences that no general assistant currently replicates.
Ceiling economics
Specialists sometimes sell volume more cheaply than generalists sell it. Midjourney Standard at $30 includes unlimited generation in relax mode, with waiting rather than credits as the constraint. For a buyer producing hundreds of images per month, that ceiling is more valuable than any bundled feature.
Continuity risk
Consolidation concentrates exposure to a single roadmap, and 2026 supplied concrete examples of why that matters. The standalone Sora consumer product was discontinued on 26 April 2026, with access continuing only inside ChatGPT subscriptions. OpenAI removed DALL-E 2 and 3 from its API in May 2026, and GPT Image 1 is scheduled for deprecation in October 2026. Any workflow built on a single vendor inherits that vendor's retirement decisions.
Maximum capability is not automatically worth maximum price
Ramp's token level data offers a useful check on the assumption that the most powerful tool is the right purchase. One month after the launch of Anthropic's most capable model, it accounted for only 6 percent of tokens businesses bought from Anthropic and 11.4 percent of dollars spent, despite being the strongest model available. Buyers are already declining to pay for headroom they do not use.
The free tier keeps eating the bottom of the market
Several categories no longer justify a paid specialist at all. Free options currently cover document research with citations, cited web answers, meeting notes, local image generation and academic literature discovery. Any consolidation exercise should test the free tier before assuming a paid replacement is required.
The Four Gate Override
The coefficient measures the size of the opportunity. The gates decide whether acting on it is safe. A specialist subscription is justified when it clears a named gate, and not when it merely feels useful.
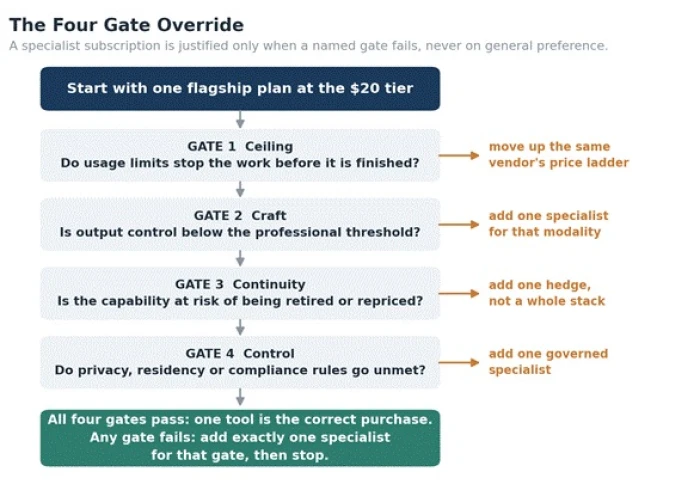
Figure 8. The Four Gate Override. Each failed gate authorizes exactly one additional subscription.
| Gate | Test question | Evidence that counts as a failure | Correct response |
| 1. Ceiling | Do usage limits stop the work before it is finished? | Repeated cap warnings in a normal week, not a peak week | Move up the same vendor's ladder before adding a vendor |
| 2. Craft | Is output control below the professional threshold? | A named control the flagship does not expose, such as private generation or professional cloning | Add one specialist for that modality only |
| 3. Continuity | Is the capability at risk of retirement or repricing? | A published deprecation notice or a product already withdrawn | Add one hedge, not a parallel stack |
| 4. Control | Do privacy, residency or compliance rules go unmet? | A written policy the flagship plan cannot satisfy | Add one governed specialist and document the exception |
Table 9. Gate tests and permitted responses. Any gate that fails authorizes one purchase, then the review stops.
The Verdict
For most buyers, one powerful tool is the correct default, and the evidence for that conclusion is unusually consistent. Flagship prices have converged at $20, the bundle inside that price has widened to cover research, images, documents, code and agents, AI point tools show the worst utilization rate of any software category at roughly 38 percent, and the switching overhead created by fragmentation exceeds the combined subscription cost of a typical four tool stack at almost any realistic hourly rate.
The five tool threshold is the cleanest way to hold the decision in mind. Five $20 subscriptions cost $1,200 per year, which is exactly the price of one high usage plan from any of the three major vendors. Any stack approaching that size should be justified against the higher tier of a single vendor rather than against the free plan it replaced.
The one line answer Start with one flagship plan at the standard tier. Add a specialist only when a named gate fails, and move up the same vendor's ladder before adding a second vendor. On the models above, that discipline is worth between $839 and $2,172 per year depending on profile, before the switching tax is counted. |